The first difficulty in discussing an AAS / PowerBI functionality is to create a test environment that is interesting enough. StackOverflow proposed by Brent Ozar looks like a good fit. The Extra-Large version has the merit of making more than 300 GB of data and of providing several areas of interesting analysis. The tabular model used for this example is about 10 GB.
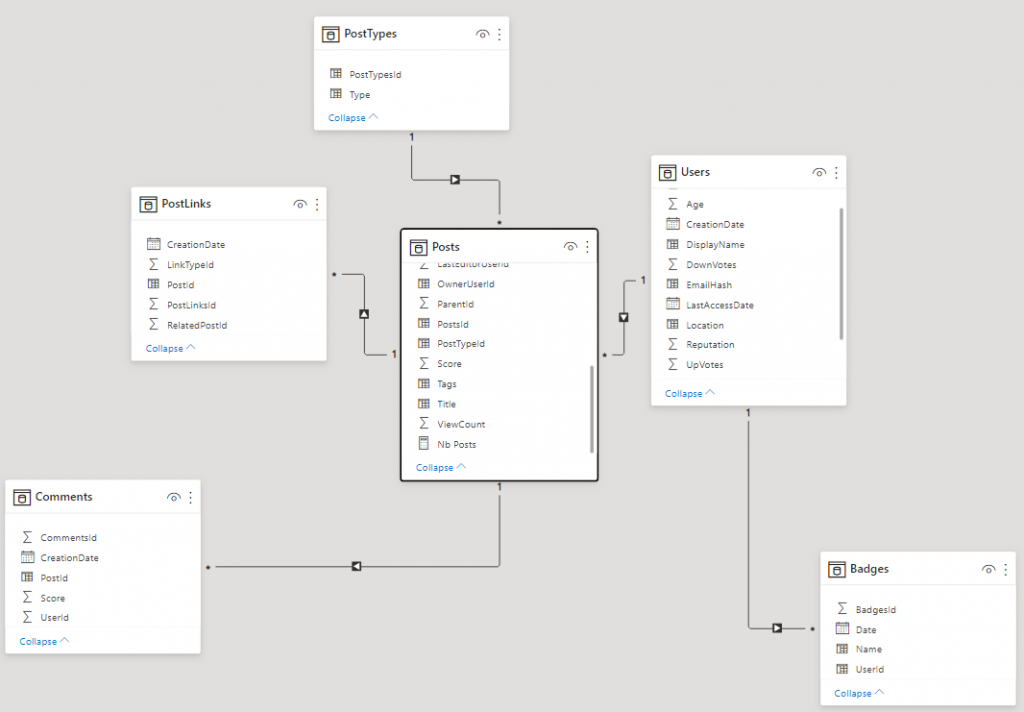
Implementation
For this example, let’s take a use case old as the Analysis Services models themselves! https://www.sqlbi.com/articles/datetool-dimension-an-alternative-time-intelligence-implementation/ (published on 2007!) The implementation of two axes of analysis dedicated to the aggregation and comparison of temporal data (also called time intelligence).
DateAggregation a dimension allowing to choose period of data analysis.
- Regular
- Year To Date
- Last 12 Months
- Total Current Year
DateComparison a dimension allowing to choose the representation of this data.
- Regular
- Previous Year
- Diff. Over Previous Year
- Diff. % Over Previous Year
Taking this example allows me to realize that it will have taken 8 years before I can finally regain the ability to do this type of , quite classic on Multidimensional SSAS, implementation properly (but hey, we will not do the old person 👴🏼 …) .
Before Calculation Group
The simplest solution without Calculation Group is to use a SWITCH and a SELECTEDVALUE and two DAX reference tables as below.
DateAggregation = DataTable("DateAggregation", STRING
               ,{
                    {"Regular"},
                    {"Year To Date"},
                    {"Last 12 Months"},
                    {"Total Current Year"}
                }
           )
DateComparison = DataTable("DateComparison", STRING
               ,{
                    {"Regular"},
                    {"Previous Year"},
                    {"Diff. Over Previous Year"},
                    {"Diff. % Over Previous Year"}
                }
           )
Now let’s choose a measure, because indeed one of the limits of this approach and the code will have to apply to each measure …
So I have a Nb Posts metric that represents the number of questions on Stack Overflow.
Nb Posts = COUNTROWS('Posts')
To understand the example, let’s separate the different steps into different measures:
Nb Posts DateAggregation = SWITCH(SELECTEDVALUE('DateAggregation'[DateAggregation],"Regular")
    ,"Regular",[Nb Posts]
    ,"Year To Date",CALCULATE([Nb Posts],DATESYTD('Date'[Date]))
    ,"Last 12 Months",CALCULATE (   [Nb Posts],
                                    DATESINPERIOD (
                                        'Date'[Date],
                                        MAX ( 'Date'[Date] ),
                                        -1,
                                        YEAR
                                    )
                                )
    ,"Total Current Year",CALCULATE([Nb Posts]
                            ,FILTER(ALL('Date')
                                ,VALUE('Date'[Calendar Year])=YEAR(MAX('Date'[Date])                                                )
                                )
                            )
    )

The integration of the measure using Date Comparison to compare dates is performed with the following measure.
Nb Posts DateComparison =
SWITCH (
    SELECTEDVALUE ( 'DateComparison'[DateComparison], "Regular" ),
    "Regular", [Nb Posts DateAggregation],
    "Previous Year",
        CALCULATE (
            [Nb Posts DateAggregation],
            PARALLELPERIOD ( 'Date'[Date], -1, YEAR )
        ),
    "Diff. Over Previous Year",
        CALCULATE (
            [Nb Posts DateAggregation],
            PARALLELPERIOD ( 'Date'[Date], -1, YEAR )
        ) - [Nb Posts DateAggregation],
    "Diff. % Over Previous Y",
        DIVIDE (
            [Nb Posts DateAggregation]
                - CALCULATE (
                    [Nb Posts DateAggregation],
                    PARALLELPERIOD ( 'Date'[Date], -1, YEAR )
                ),
            CALCULATE (
                [Nb Posts DateAggregation],
                PARALLELPERIOD ( 'Date'[Date], -1, YEAR )
            )
        )
)
Note that it is therefore necessary to nest the two measures, which de facto creates a strong link between the two types of DateAggregation and DateComparison analyzes. This is mandatory if we want to be able to mix these axes (and if I wanted to cross 3, 4, 5 axes I would similarly be obliged to continue this encapsulation or to increase my switch outputs).
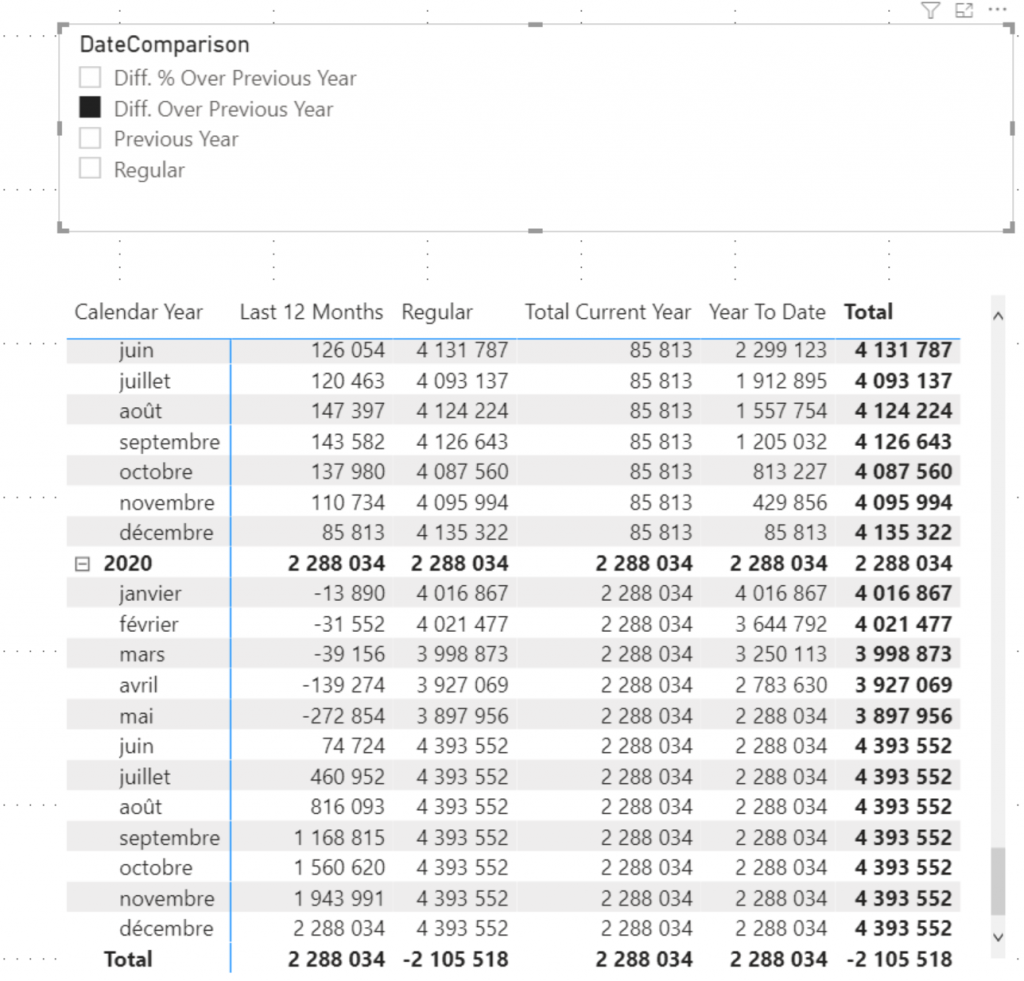
The result is satisfactory, we are able to cross the two axes and obtain a powerful tool for temporal analysis. However, we quickly notice the maintainability limits of the solution (this code must be multiplied by measurement). Moreover, let’s imagine that after having deployed this “template” on 20 measures I decide to optimize the template by using for example variables (that would seem a good idea 😉) I would have to update a significant amount of code and the risk error is very important.
With Calculation Group
Since the arrival of Calculation Groups it is much easier, from Tabular Editor or Visual Studio it is possible to update a Calculation Group and Items containing the calculation rule to be applied when selecting them.
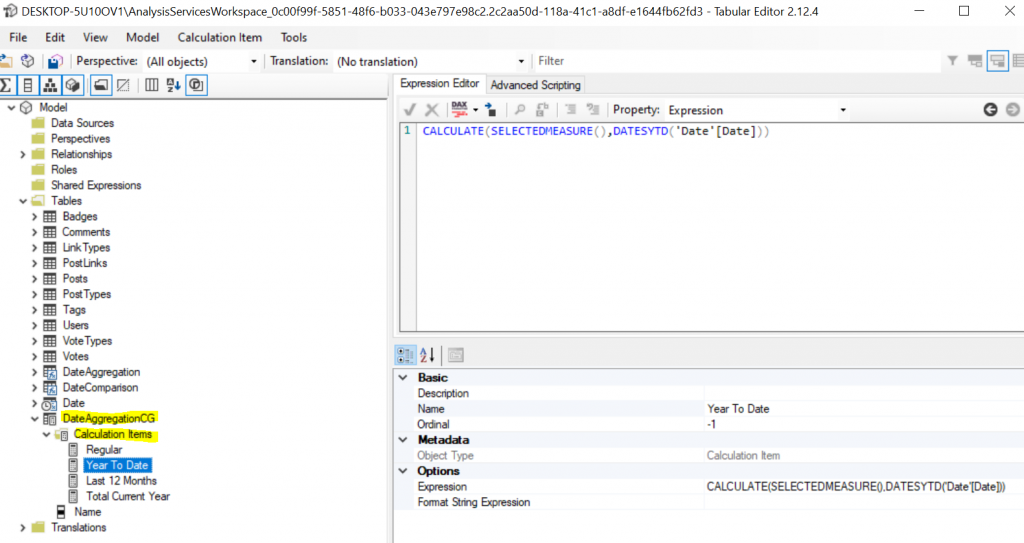
The calculations are identical to the SWITCH implemented previously but rather than using a static measure [Nb Post], we use SELECTEDMEASURE () which makes it possible to apply the calculation rule to all measures evaluated during the selection of an ITEM.
No need to create a configuration table, the calculation item is self-supporting.

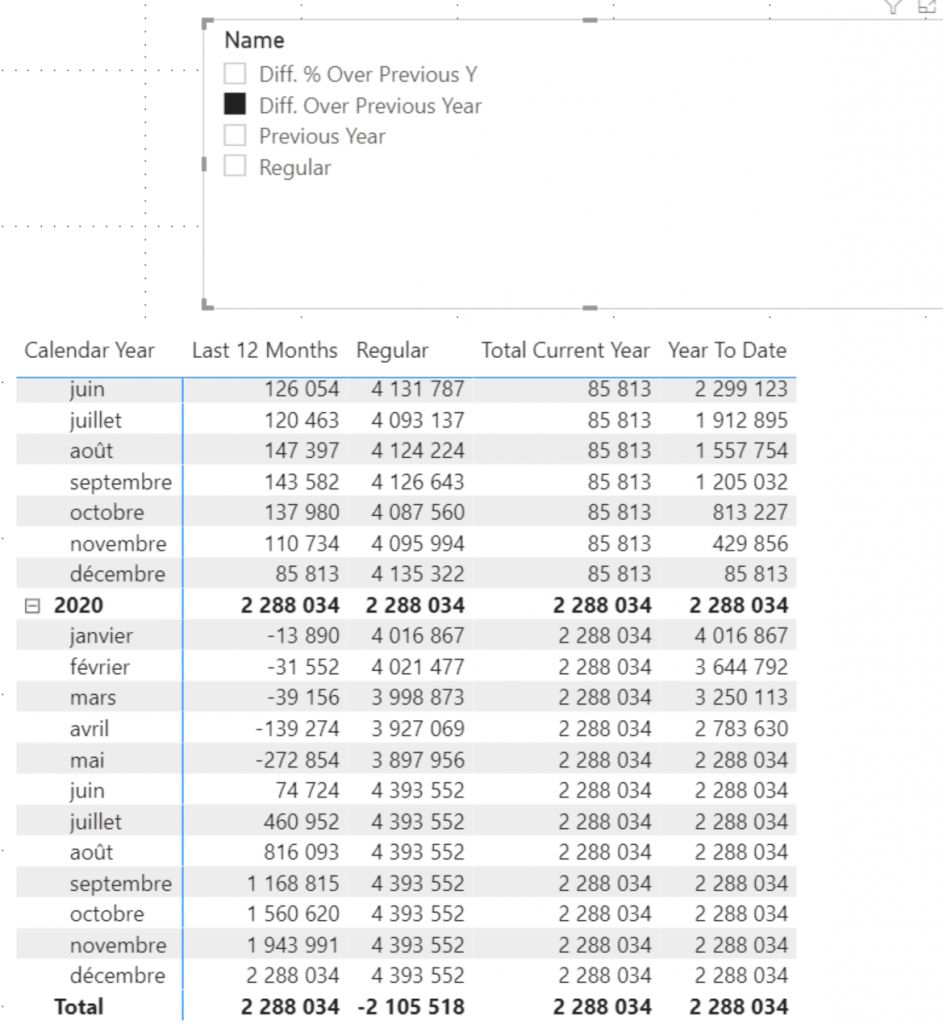
The power of the Calculation Group is all the more evident when we implement our second line of analysis.
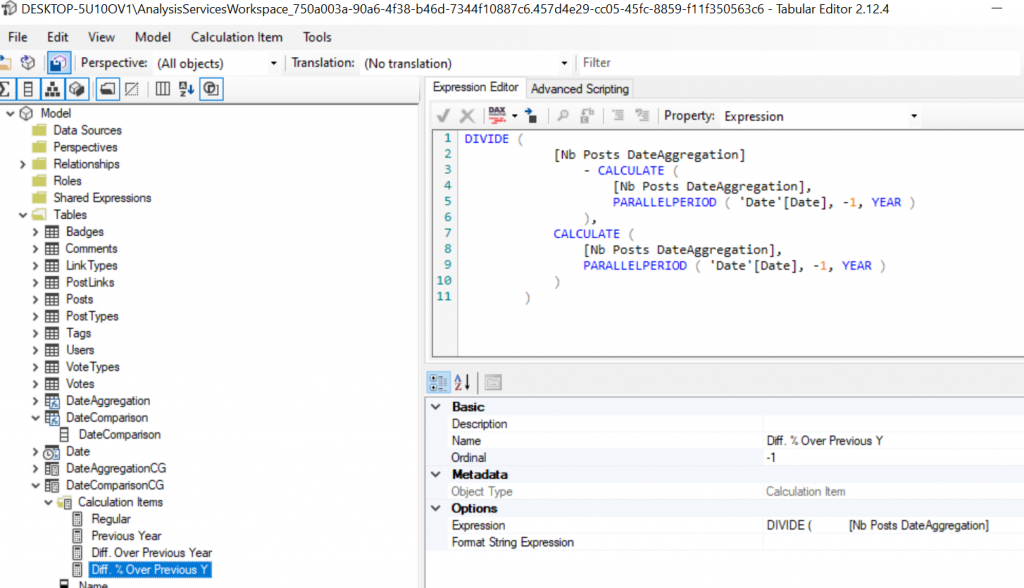
The main interest here is that there is no longer any need to link our two axes, the two Calculation Groups propagate their filter contexts as well, if both are used their effects will be cumulative.
Performance impacts
Consider a simple query:
--SWITCH IMPLEMENTATION
EVALUATE
SUMMARIZECOLUMNS(DateAggregation[DateAggregation]
,'Date'[Calendar Year]
,'Date'[Month Name]
,"nb Post",[Nb Posts DateAggregation]
)
--CALCULATION GROUP IMPLEMENTATION
EVALUATE
SUMMARIZECOLUMNS(DateAggregationCG[Name]
,'Date'[Calendar Year]
,'Date'[Month Name]
,"nb Post",[Nb Posts]
)
On the storage engine side, no impact, the two requests behave in exactly the same way.

Query Plan side, it is not the same story, differences exist which suggests that under certain conditions, performance could vary.
What about using the two axes of our Date Tool (DateAgg and DateComp) on performance?
--SWITCH IMPLEMENTATION
EVALUATE
SUMMARIZECOLUMNS(DateAggregation[DateAggregation]
,'Date'[Calendar Year]
,'Date'[Month Name]
,FILTER('DateComparison','DateComparison'[DateComparison]="Diff. Over Previous Year")
,"nb Post",[Nb Posts DateComparison]
)

--CALCULATION GROUP IMPLEMENTATION
EVALUATE
SUMMARIZECOLUMNS(DateAggregationCG[Name]
,'Date'[Calendar Year]
,'Date'[Month Name]
,FILTER('DateComparisonCG','DateComparisonCG'[Name]="Diff. Over Previous Year")
,"nb Post",[Nb Posts]
)
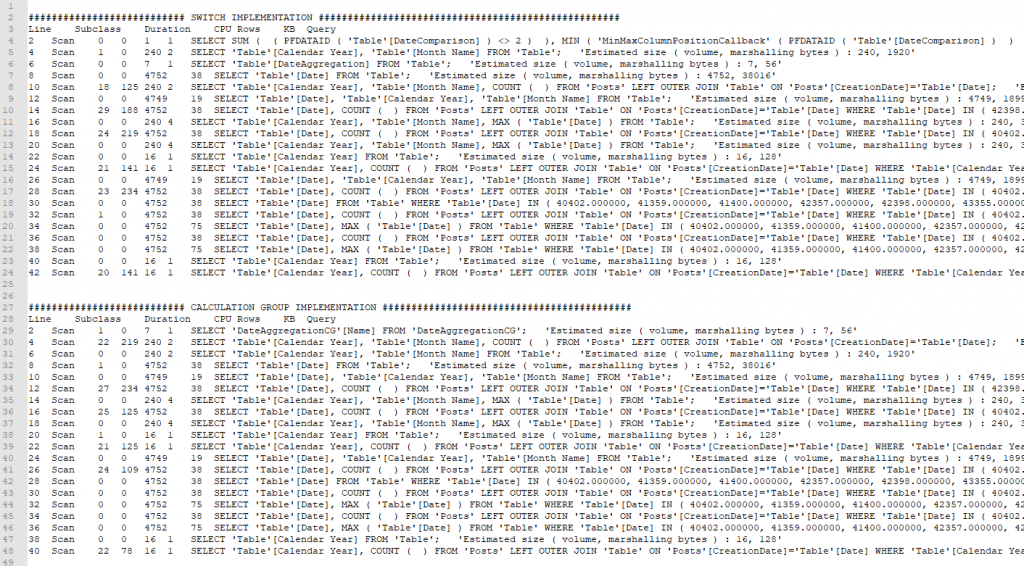
Storage engine requests are starting to stand out and the Calculation Group is taking the lead, with one less request and less CPU usage overall.
This is not directly related to the implementation of the Calculation Group and it is certainly possible by reworking the initial SWITCH (mainly using only one measure) to obtain a fairly equivalent plan.
However, the simplicity of implementation of the Calculation Group makes it easier to carry out efficient measurements.
Complexities induced by Calculation Group
When you get to this Chapter (and if you’ve had the courage to read it all), you might think that the Calculation Group only has advantages. Indeed, maintenance is infinitely easier, and the simpler implementation often implies performance gains. However, all is not rosy in the world of Calculation Groups.
Indeed, as in the days of MDX SCOPE, several problems arise from their use.
All measurements are impacted when using a Calculation Group. And so when you have a Calculation Group as a page filter, for example, this will apply to all your measurements (unless otherwise specified in the item implementation).
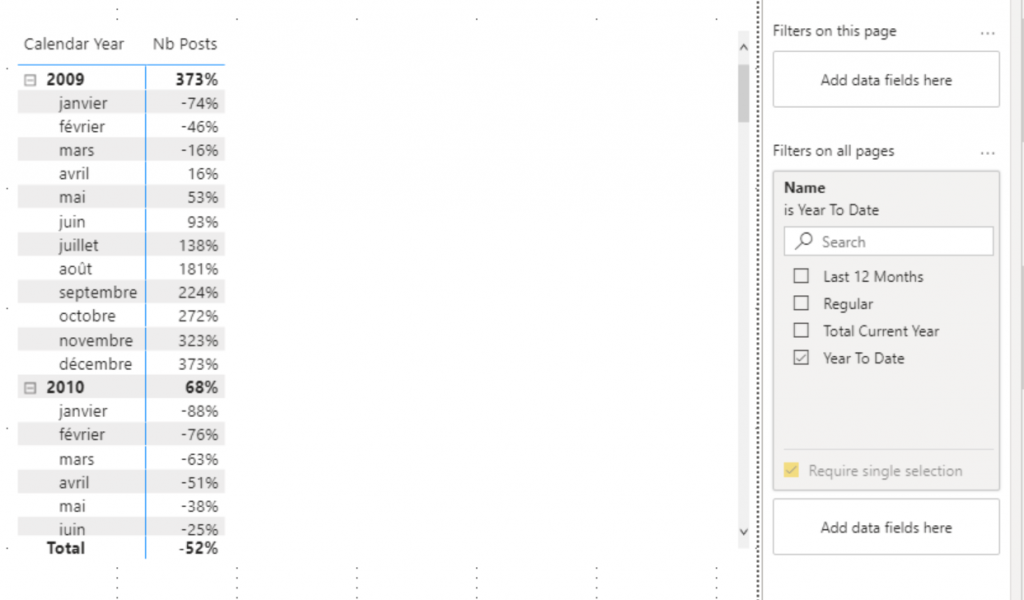
When you first create the report it seems obvious and then over time you create a metric that shouldn’t be displayed in YTD that doesn’t just work on that report without understanding why.
It is also necessary to always think about the order of evaluation of Calculation Groups. Indeed what if I have a Calculation Group that allows me to choose a type of aggregation in addition to the one that allows me to make temporal comparisons.
First Calculation Group, we display two comparisons:

Then we decide to apply a Calculation Group which allows you to change the aggregation applied to the measures.
AVERAGEX(VALUES('Date'[Date]),SELECTEDMEASURE())

The result does not seem satisfactory, obviously the average is not applied at the right time, to manage the application order of Calculation Group a property is available at this level, the precedence. Calculation Groups are evaluated in ascending order of their precedence.
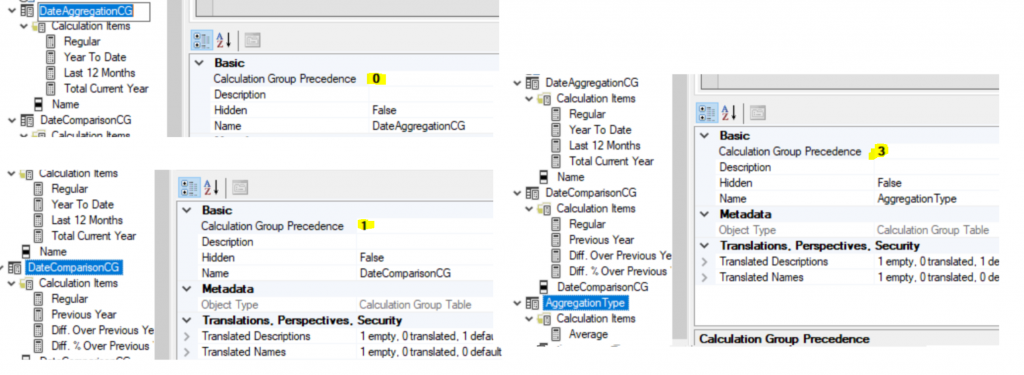
By default, the precedence is incremented in the order in which the Calculation Groups are created.
In our case, this causes DateComparisonCG to be evaluated before the AggregationType. Which is not the intended behavior.
Passing DateComparaisonCG to 4.

The result changes completely.
With these two examples and by imagining a model with 4,5,10,30 Calculation Group you can imagine the problems that it is possible to encounter and how important it is to adhere to a few rules like:
- Limit the complexity of Calculation Groups as much as possible
- Limit their number within the same model, especially if their scope is wide
In conclusion, like the SCOPE in the MDX era, the capacities offered by the Calculation Groups are enormous (not everything is in this little article). However, while these are powerful they are also difficult for the end user to understand and can make it difficult to use your model. They should therefore be used in a specific framework in addition to a well-named, well-modeled (star schema) models and on simple use cases.


